Total number of forecast/observation records used to generate statistic
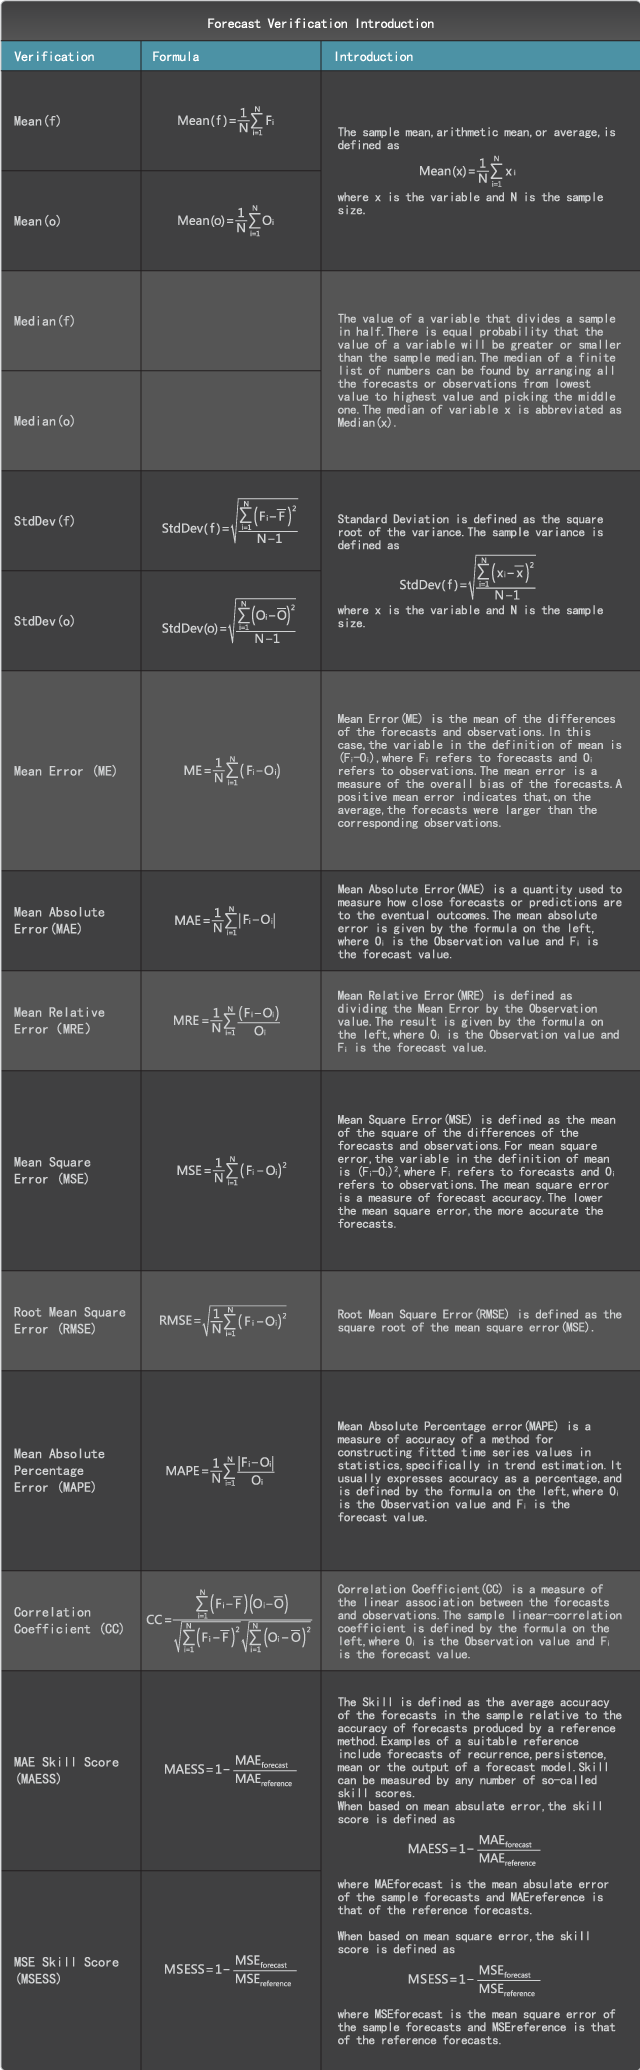
Mean (f)
Mean forecast
Mean (o)
Mean observation
Median (f)
Median forecast
Median (o)
Median observation
Std Dev (f)
Standard deviation of forecasts
Std Dev (o)
Standard deviation of observations
ME
Mean error
MAE
Mean absolute error
MRE
Mean relative error
RMSE
Root mean square error
MAPE
Mean absolute percent error
CC
Correlation coefficient between forecasts and observations
MAESS
Mean absolute error skill score
MSESS
Mean square error skill score
Forecast Type: F10.7 Solar Flux
Query:
Plot
1Forecast VS Observation Plot
2Forecast ME,MAE,MRE,MAPE Plot
3F10.7 Forecast Linear Association Plot
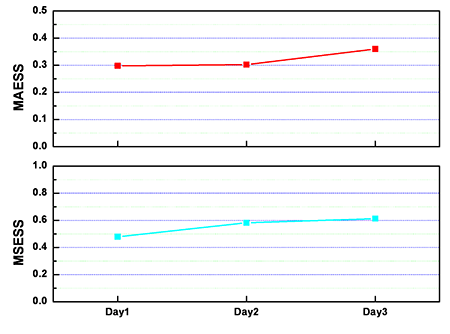
4Forecast Skill VS Lead Time
This plot shows SEPC forecast skill as a function of lead-time for forecasts of 10.7 cm solar flux. The skill of forecasts produced by SEPC is compared to that of forecasts produced by 27-day recurrence. Negative values indicate no skill above constant forecasts of sample recurrence.
Verification Statistics Summary Tables
Total Records
Total number of forecast/observation records used to generate statistic
Mean (f)
Mean forecast
Mean (o)
Mean observation
Median (f)
Median forecast
Median (o)
Median observation
Std Dev (f)
Standard deviation of forecasts
Std Dev (o)
Standard deviation of observations
ME
Mean error
MAE
Mean absolute error
RMSE
Root mean square error
CC
Correlation coefficient between forecasts and observations
MAESS
Mean absolute error skill score
MSESS
Mean square error skill score
Forecast Type: Forecast Ap Index
Query:
Plot
1Forecast VS Observation Plot
2Forecast ME,MAE,RMSE Plot
3Forecast Linear Association Plot
4Forecast Skill VS Lead Time
This plot shows forecast skill as a function of lead-time for forecasts of Ap index. The skill of forecasts issued by SEPC is compared to that of forecasts produced by 27-day recurrence. Negative values indicate no skill above constant forecasts of sample recurrence.